

In the print dialog, choose "Save as PDF" as the destination.
Machine Learning, Week 8
k-Means Clustering
Group customers that carry no labels at all: assign, update, repeat. Then segment 200 customers for a campaign.
Objectives
- ▸Tell supervised learning from clustering
- ▸Run k-means by hand: assign to the nearest centroid, move to the mean, repeat
- ▸Compute the WCSS, which scikit-learn calls
inertia_ - ▸Fit
KMeans, readcluster_centers_andlabels_, choose k with the elbow method - ▸Segment customers and pick the segment a campaign should target
- ▸Explain why a different start can give a different result, and what
n_initdoes
Week 8 of the plan
Where This Sits in the Course
- ▸Two notebooks: Clustering (blobs, then 200 mall customers) and K_Means_Clustering_Practice (777 US colleges)
- ▸Real-world scenario: segmenting customers from their data to decide who gets a campaign for a new product or a promotion to increase their purchasing
- ▸Project milestone this week: Project Teams Presentations and Discussions
Plan for the Two Hours
| Part | What we do | Time |
|---|---|---|
| 1 | Clustering and k-means, then five customers by hand | 40 min |
| 2 | Notebook 1: blobs and the elbow method | 15 min |
| 3 | Notebook 1: segmenting customers | 20 min |
| 4 | Notebook 2: colleges, and the project milestone | 15 min |
| 5 | Practice with answers, then takeaways | 30 min |
Part 1
The Idea of Clustering
Find groups of similar rows, with no labels to learn from
Supervised Learning vs Clustering
| Supervised (weeks 3 to 7) | Clustering (this week) | |
|---|---|---|
| Training data | features X and a label y | features X only |
| The model learns | how to predict y | groups of similar rows |
| Example | KNN predicts the iris species | k-means finds customer segments |
| Checking the result | compare with the true y | usually no true answer exists |
What Is k-Means?
- k-means
- Divides the samples into k clusters that do not overlap. Each cluster is described by the mean of its samples: its centroid.
- ▸You choose k, the number of clusters
- ▸A centroid is usually not one of the data points, but it lives in the same space
- ▸For customers described by (income, spending), a centroid is also an (income, spending) pair
The Algorithm
- 1Choose k and place k starting centroids, for example on k random data points
- 2Assign: every point joins its nearest centroid (squared Euclidean distance)
- 3Update: every centroid moves to the mean of its points
- 4Repeat assign and update until no point changes its cluster
Two Formulas
A point (x, y), a centroid (a, b), a cluster with n points
- ▸The assign step uses d²: no square root is needed, it never changes which centroid is nearest
- ▸The update step uses the two means: the new centroid is the average point of its cluster
- ▸Same distance as KNN in week 5, now measured to centroids
By hand
Worked Example: Five Customers
Five real customers from notebook 1: annual income (k$) and spending score (1 to 100)
| Customer | Income (k$) | Spending score |
|---|---|---|
| #11 | 19 | 14 |
| #49 | 40 | 42 |
| #62 | 46 | 55 |
| #136 | 73 | 88 |
| #190 | 103 | 85 |
Iteration 1: Assign
μ1 = (19, 14), μ2 = (46, 55); difference = customer minus centroid
| Customer | d² to μ1 | d² to μ2 | Joins |
|---|---|---|---|
| #11 | 0 + 0 = 0 | 729 + 1681 = 2410 | μ1 |
| #49 | 441 + 784 = 1225 | 36 + 169 = 205 | μ2 |
| #62 | 729 + 1681 = 2410 | 0 + 0 = 0 | μ2 |
| #136 | 2916 + 5476 = 8392 | 729 + 1089 = 1818 | μ2 |
| #190 | 7056 + 5041 = 12097 | 3249 + 900 = 4149 | μ2 |
Iteration 1: Update
Cluster 1: #11. Cluster 2: #49, #62, #136, #190
Iteration 2: Assign
μ1 = (19, 14), μ2 = (65.5, 67.5)
| Customer | d² to μ1 | d² to μ2 | Joins |
|---|---|---|---|
| #11 | 0 + 0 = 0 | 2162.25 + 2862.25 = 5024.5 | μ1 |
| #49 | 441 + 784 = 1225 | 650.25 + 650.25 = 1300.5 | μ1 |
| #62 | 729 + 1681 = 2410 | 380.25 + 156.25 = 536.5 | μ2 |
| #136 | 2916 + 5476 = 8392 | 56.25 + 420.25 = 476.5 | μ2 |
| #190 | 7056 + 5041 = 12097 | 1406.25 + 306.25 = 1712.5 | μ2 |
Iteration 2: Update
Cluster 1: #11, #49. Cluster 2: #62, #136, #190
Iteration 3: Assign
μ1 = (29.5, 28), μ2 = (74, 76)
| Customer | d² to μ1 | d² to μ2 | Joins |
|---|---|---|---|
| #11 | 110.25 + 196 = 306.25 | 3025 + 3844 = 6869 | μ1 |
| #49 | 110.25 + 196 = 306.25 | 1156 + 1156 = 2312 | μ1 |
| #62 | 272.25 + 729 = 1001.25 | 784 + 441 = 1225 | μ1 |
| #136 | 1892.25 + 3600 = 5492.25 | 1 + 144 = 145 | μ2 |
| #190 | 5402.25 + 3249 = 8651.25 | 841 + 81 = 922 | μ2 |
Iteration 3: Update
Cluster 1: #11, #49, #62. Cluster 2: #136, #190
Iteration 4: Nothing Moves
μ1 = (35, 37), μ2 = (88, 86.5)
| Customer | d² to μ1 | d² to μ2 | Joins |
|---|---|---|---|
| #11 | 256 + 529 = 785 | 4761 + 5256.25 = 10017.25 | μ1 |
| #49 | 25 + 25 = 50 | 2304 + 1980.25 = 4284.25 | μ1 |
| #62 | 121 + 324 = 445 | 1764 + 992.25 = 2756.25 | μ1 |
| #136 | 1444 + 2601 = 4045 | 225 + 2.25 = 227.25 | μ2 |
| #190 | 4624 + 2304 = 6928 | 225 + 2.25 = 227.25 | μ2 |
WCSS: How Tight Are the Clusters?
N points, d_i = distance from point i to its own centroid
| Iteration | J after assign | J after update |
|---|---|---|
| 1 | 6172 | 4026 |
| 2 | 3950.5 | 2904.5 |
| 3 | 2680.75 | 1734.5 |
| 4 | 1734.5 | converged |
Try It: k-Means, One Step at a Time
Part 2
Notebook 1: Blobs and the Elbow
Generated points first, so we know the right answer
Open the Notebooks in Colab
https://colab.research.google.com/github/
jeffprosise/Machine-Learning/blob/master/
Clustering.ipynbhttps://colab.research.google.com/github/
tirthajyoti/Machine-Learning-with-Python/blob/master/
Clustering-Dimensionality-Reduction/
K_Means_Clustering_Practice.ipynbFour Blobs: Ask for 3, 4 or 5 Clusters
make_blobs(n_samples=300, centers=4, cluster_std=0.8, random_state=0), then KMeans(n_clusters=k, random_state=0)
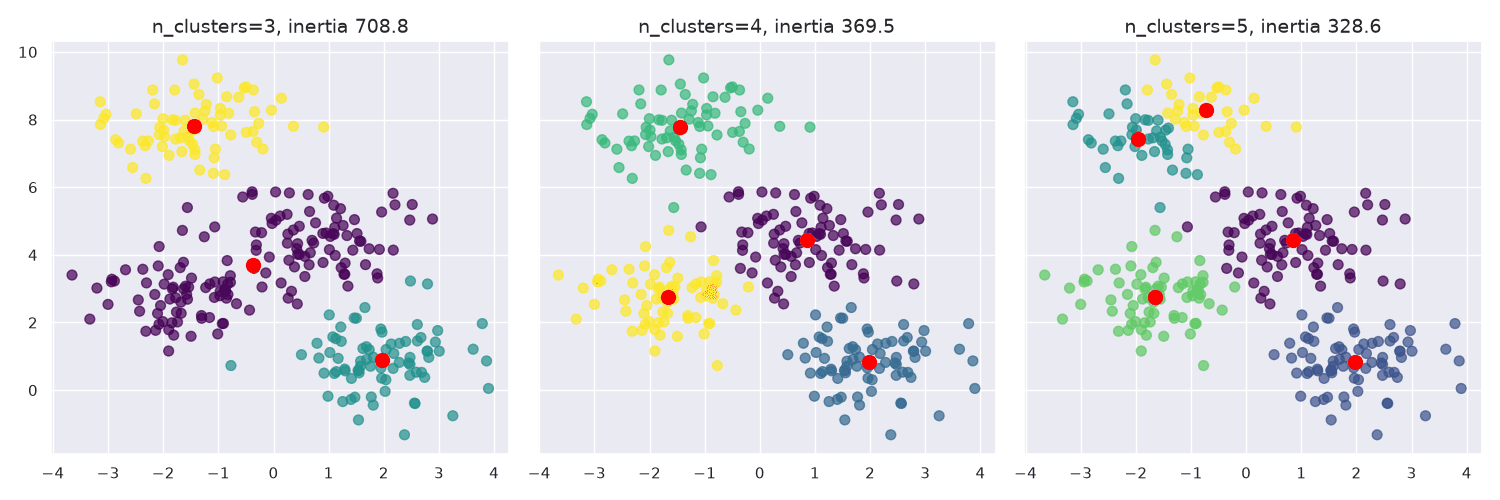
- ▸k = 3 merges two blobs into one cluster of 151 points
- ▸k = 4 finds the four blobs: 81, 74, 73 and 72 points
- ▸k = 5 cuts one real blob into 42 and 31 points
A New Point: Which Cluster?
The k = 4 model predicts (-0.5, 5) with kmeans.predict(point), then prints the distance to each centroid
[array([1.46570934]), array([4.8470332]),
array([2.93542029]), array([2.52147763])]Choosing k: the Elbow Method
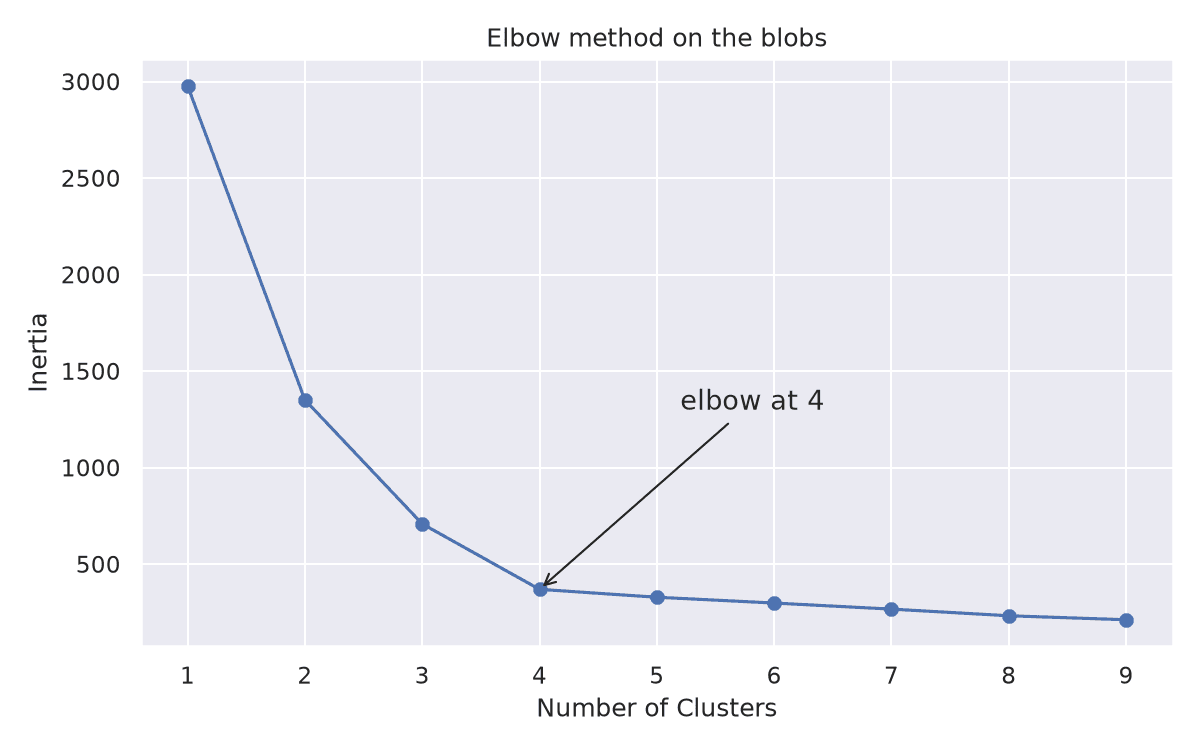
- ▸Loop k from 1 to 9 and record
kmeans.inertia_ - ▸Inertia always falls as k grows, so the smallest value is not the answer
- ▸Pick the elbow: 3 to 4 drops 339.24, 4 to 5 only 40.88
- ▸So k = 4, the number of blobs generated
Try It: Run the Elbow Loop
Part 3
Segmenting Customers
The week 8 scenario: who gets the campaign?
The Scenario
Segmenting customers based on customer data to identify which customers to target with a campaign for a new product or a promotion to increase their purchasing activity.
| Column | In the 200 customers |
|---|---|
Gender | Male or Female (88 and 112) |
Age | 18 to 70 |
Annual Income (k$) | 15 to 137 |
Spending Score (1-100) | 1 to 99: how much the customer spends |
Load and Look
customers.shape is (200, 5); info() shows no missing values
url = ("https://raw.githubusercontent.com/"
       "jeffprosise/Machine-Learning/master/"
       "Data/customers.csv")
customers = pd.read_csv(url)

points = customers.iloc[:, 3:5].values
x = points[:, 0]
y = points[:, 1]
plt.scatter(x, y, s=50, alpha=0.7)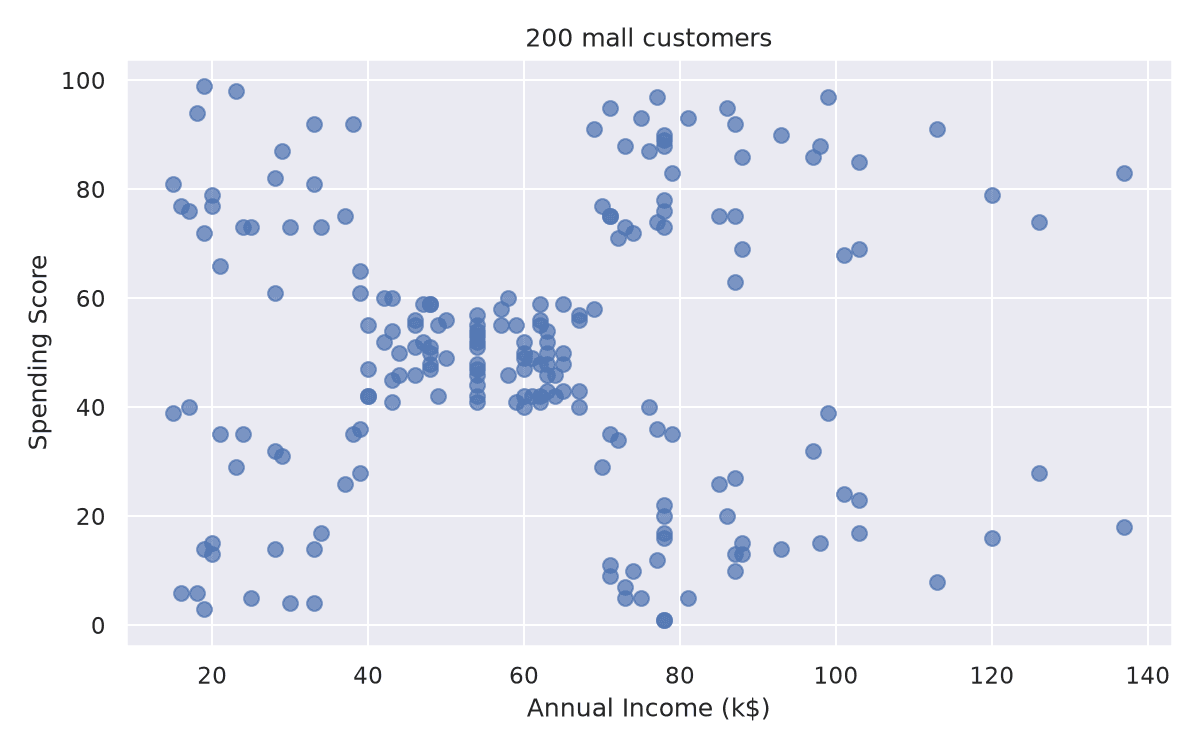
The Elbow Says 5
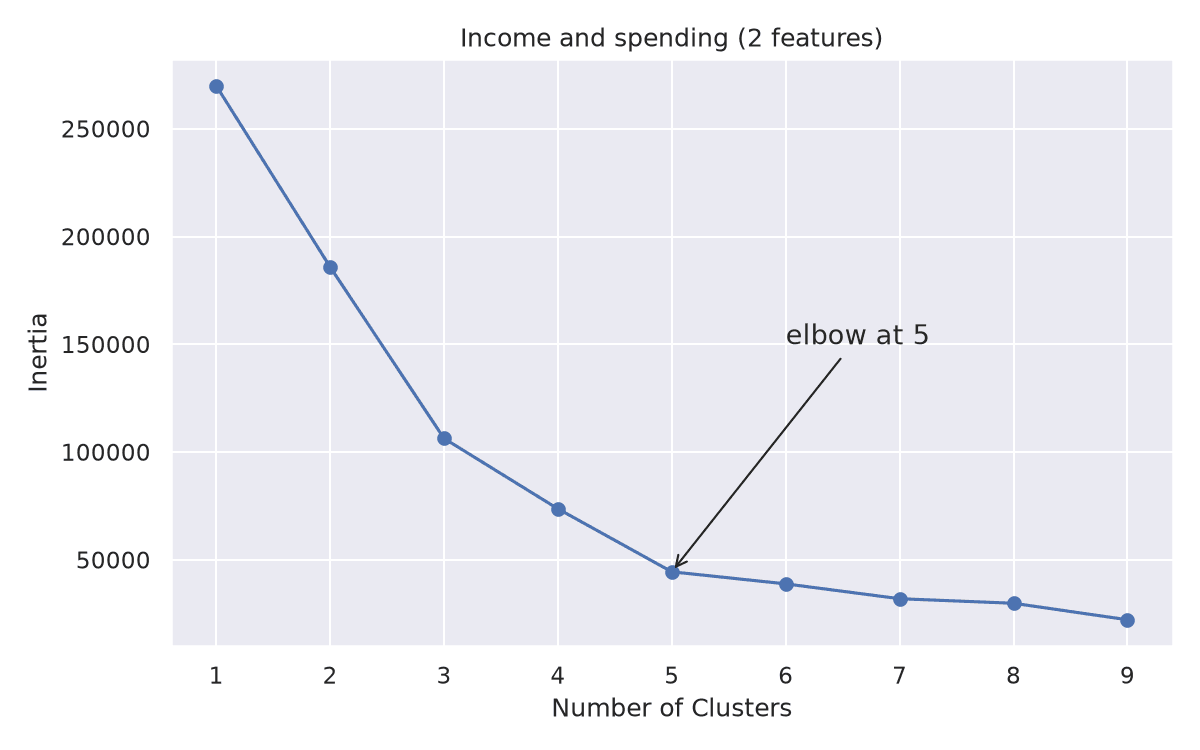
- ▸Same loop, k from 1 to 9, on income and spending
- ▸4 to 5 drops 29231.33 (73679.79 to 44448.46)
- ▸5 to 6 drops only 5589.50
- ▸The notebook segments the customers into five clusters
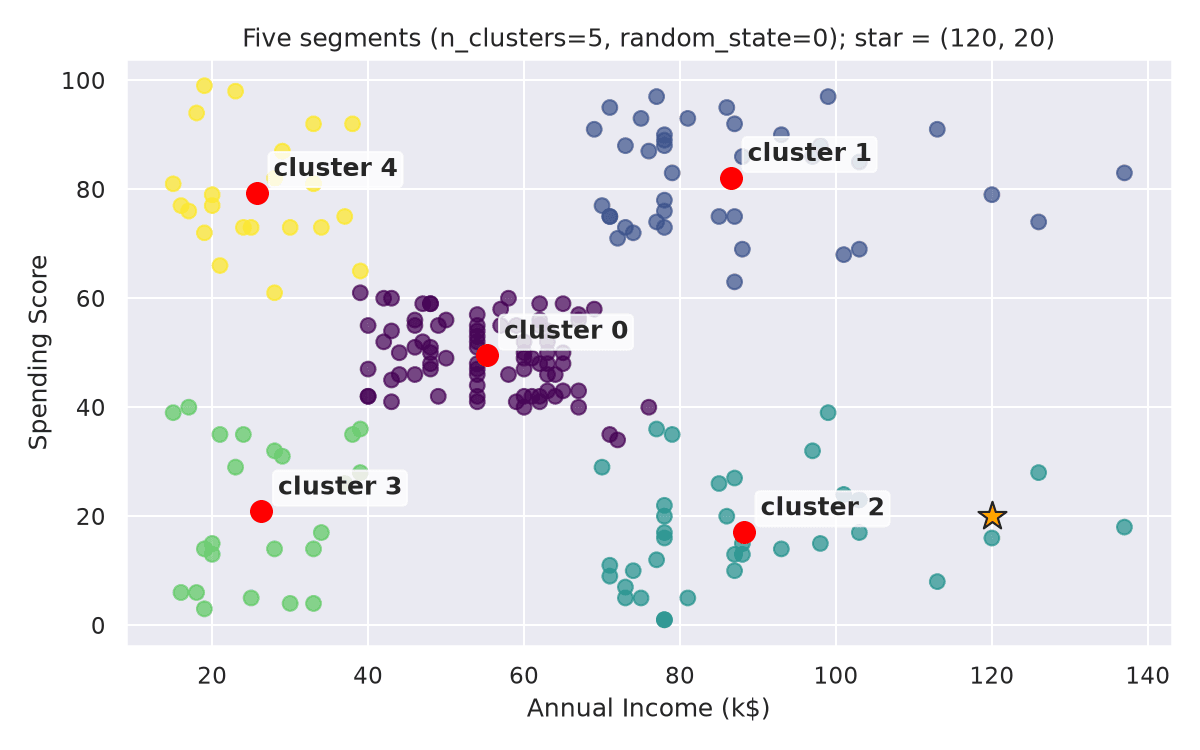
Five Segments
KMeans(n_clusters=5, random_state=0); red dots are the centroids
Which Segment Gets the Promotion?
The centroids of the five segments
| Cluster | Avg income (k$) | Avg spending | Customers |
|---|---|---|---|
| 0 | 55.30 | 49.52 | 81 |
| 1 | 86.54 | 82.13 | 39 |
| 2 | 88.20 | 17.11 | 35 |
| 3 | 26.30 | 20.91 | 23 |
| 4 | 25.73 | 79.36 | 22 |
Build the Campaign List
df = customers.copy()
df['Cluster'] = kmeans.predict(points)

cluster = kmeans.predict(np.array([[120, 20]]))[0]
clustered_df = df[df['Cluster'] == cluster]
clustered_df['CustomerID'].valuesSegment on All Four Attributes
Gender, age, income and spending; CustomerID is left out
from sklearn.preprocessing import LabelEncoder

df = customers.copy()
encoder = LabelEncoder()
df['Gender'] = encoder.fit_transform(df['Gender'])
points = df.iloc[:, 1:5].values

kmeans = KMeans(n_clusters=5, random_state=0)
kmeans.fit(points)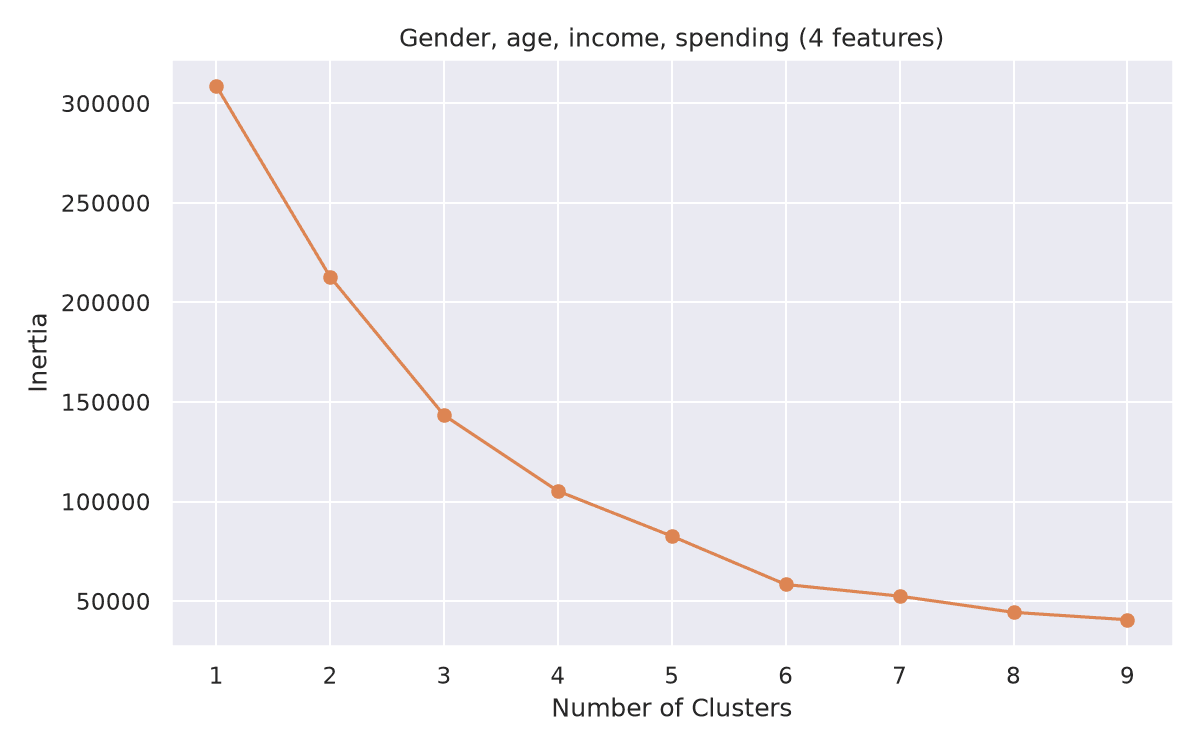
Four-Feature Segments
The report loop of the notebook, one row per cluster
| Cluster | Avg age | Avg income | Avg spending |
|---|---|---|---|
| 0 | 54.06 | 40.46 | 36.72 |
| 1 | 32.69 | 86.54 | 82.13 |
| 2 | 25.25 | 25.83 | 76.92 |
| 3 | 41.65 | 88.74 | 16.76 |
| 4 | 33.40 | 58.06 | 48.77 |
A Different Start, a Different Result
The saved notebook shows other ages for the same cell: 45.22, 32.69, 43.09, 40.67, 25.52
- ▸The start is random (
init='k-means++'), fixed byrandom_state - ▸
n_init= how many starts to run; the run with the smallest inertia is kept - ▸Since scikit-learn 1.4 the default
n_init='auto'means one start
| Setting | Inertia | Cluster sizes |
|---|---|---|
| one start (default) | 82657.05 | 50, 39, 24, 34, 53 |
n_init=10 | 75399.62 | 23, 39, 79, 23, 36 |
Part 4
Notebook 2: The Colleges
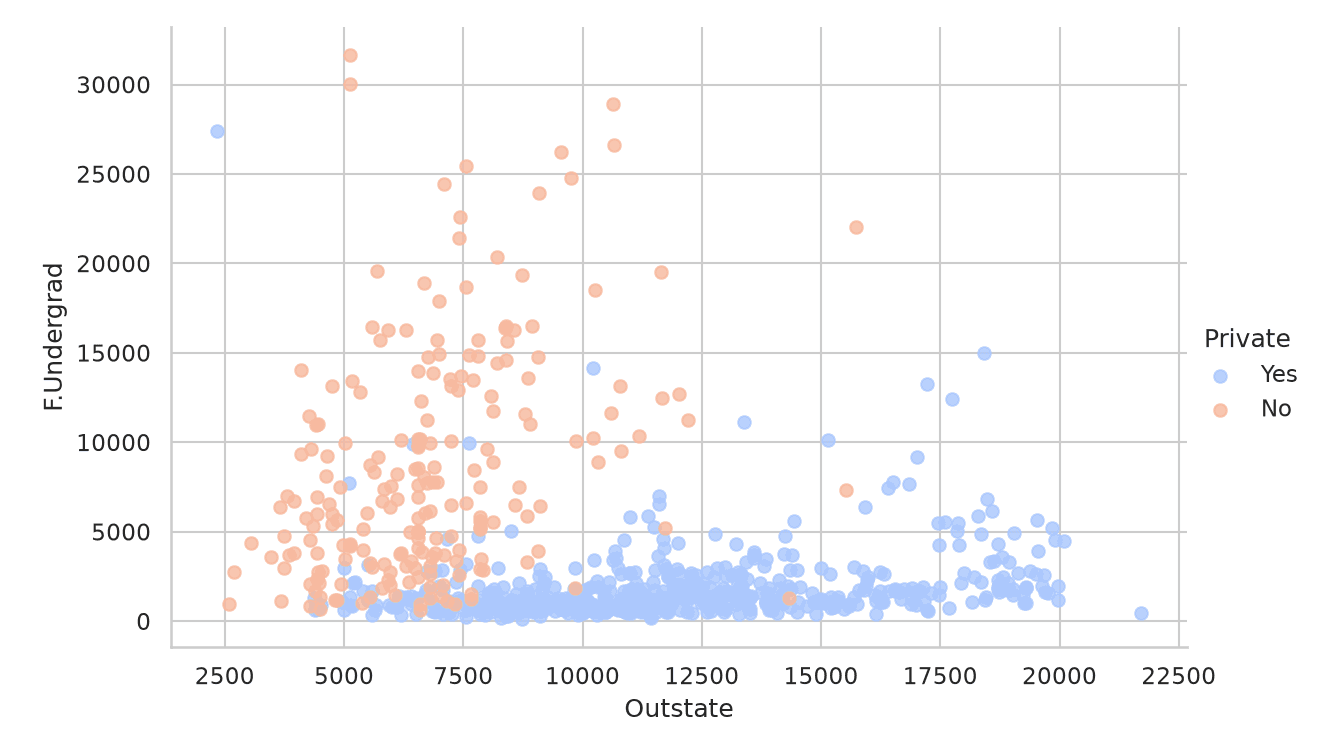
Can k-means find private and public colleges without the labels?
777 Colleges, Two Clusters
- ▸
Private(YesorNo) and 17 numbers:Apps,F.Undergrad,Outstate,Expend, ... - ▸565 private and 212 public colleges
- ▸Cluster on the 17 numbers only, then compare with
Private - ▸Real clustering has no labels; here they let us score the result
Three Cells to Fix
url = ("https://raw.githubusercontent.com/"
       "tirthajyoti/Machine-Learning-with-Python/"
       "master/Datasets/College_Data")
df = pd.read_csv(url, index_col=0)
df.loc['Cazenovia College', 'Grad.Rate'] = 100- ▸
College_Datais not next to the notebook in Colab: read it fromDatasets - ▸
df['Grad.Rate']['Cazenovia College'] = 100is chained assignment: with pandas 3 it only warns and the rate stays 118. Use.loc - ▸seaborn now needs
x=andy=by name, andheight=instead ofsize=inlmplotandFacetGrid
Fit Two Clusters
We added random_state=0 so the run is repeatable
kmeans = KMeans(n_clusters=2, verbose=0, tol=1e-3, max_iter=300,
                n_init=20, random_state=0)
kmeans.fit(df.drop('Private', axis=1))| Feature | Cluster 0 (669) | Cluster 1 (108) |
|---|---|---|
Apps | 1813.2 | 10363.1 |
F.Undergrad | 2188.5 | 13061.9 |
Outstate | 10395.7 | 10719.2 |
Expend | 8932.0 | 14170.5 |
Compare the Clusters with the Labels
Cluster = 1 for a private college, 0 for a public one; A = accuracy
print(confusion_matrix(df['Cluster'], kmeans.labels_))
# [[138  74]
# [531 34]]Swap the Cluster Numbers
1 - kmeans.labels_: the matrix saved in the notebook
| Cluster 0 | Cluster 1 | |
|---|---|---|
| Public (0) | 74 | 138 |
| Private (1) | 34 | 531 |
Before you practise
Common Mistakes
- ▸Treating cluster numbers as meaningful: read the centroids
- ▸Picking the k with the smallest inertia instead of the elbow
- ▸Trusting one start: use
n_init=10or more - ▸Clustering on an ID column, or passing text columns without encoding them
- ▸Scoring clusters against labels before matching the numbers
- ▸Writing
df1 = dfwhen you meandf1 = df.copy(): the notebook's last cell leaks the labels this way
Your team project
Project Milestone: Presentations and Discussions
- 1The problem and the dataset: rows, features, target
- 2How you cleaned and explored the data, with one or two plots
- 3The models you built since week 3, scored on the same test split
- 4The model you keep, and why
- 5What is still missing, and your plan
Part 5
Practice: Your Turn
About 30 minutes, answers after each task
About 10 minutes
Practice 1: A Different Start
- 1Same five customers, k = 2, start at μ1 = #11 = (19, 14) and μ2 = #136 = (73, 88)
- 2Assign and update until no customer changes cluster
- 3Write the final clusters, centroids and
J - 4How many assign steps did you need, compared with the worked example?
Answers
Practice 1: Answer
Iteration 1: distances to μ1 = (19, 14) and μ2 = (73, 88)
| Customer | d² to μ1 | d² to μ2 | Joins |
|---|---|---|---|
| #11 | 0 | 2916 + 5476 = 8392 | μ1 |
| #49 | 441 + 784 = 1225 | 1089 + 2116 = 3205 | μ1 |
| #62 | 729 + 1681 = 2410 | 729 + 1089 = 1818 | μ2 |
| #136 | 8392 | 0 | μ2 |
| #190 | 7056 + 5041 = 12097 | 900 + 9 = 909 | μ2 |
About 5 minutes
Practice 2: Which Segment?
A new customer: income 100, spending 50
| Cluster | Centroid (income, spending) |
|---|---|
| 0 | (55.3, 49.5) |
| 1 | (86.5, 82.1) |
| 2 | (88.2, 17.1) |
| 3 | (26.3, 20.9) |
| 4 | (25.7, 79.4) |
About 5 minutes
Practice 3: Score the College Clusters
After the swap; A accuracy, P_1 precision and R_1 recall of the private class
| Cluster 0 | Cluster 1 | |
|---|---|---|
| Public (0) | 74 | 138 |
| Private (1) | 34 | 531 |
About 10 minutes
Practice 4: In Colab
- 1Notebook 1, five segments on income and spending: predict
[[100, 50], [20, 90]]in one call - 2Re-run the four-feature model with
n_init=10: printinertia_andnp.bincount(kmeans.labels_) - 3Notebook 2 with
random_state=2: print the confusion matrix andaccuracy_score
| Task | Result |
|---|---|
| 1 | [1 4]: high/high and low income, high spending |
| 2 | 75399.62, sizes [23 39 79 23 36] |
| 3 | [[74 138] [34 531]], accuracy 0.7786: only the names changed |
Key Takeaways
- 1Clustering finds groups in data with no labels
- 2k-means repeats assign (nearest centroid) and update (mean) until nothing changes
- 3The WCSS (
inertia_) measures tightness; neither step can raise it - 4Choose k at the elbow, not at the smallest inertia
- 5The result depends on the start: use
n_init - 6Cluster numbers are arbitrary: read the centroids and name the segments
Open this lesson
Mahmoud Abas|k-Means Clustering